Pismo operations status
The operations status page helps keep you informed about systems availability, scheduled maintenance, and incident reports. You can also use this resource to subscribe to push notifications. Please note that for incident reports, each request type has an Operational Level Agreement (OLA) that defines the expected resolution time based on the issue's nature and urgency. Refer to Request types and common fields for more information. For status messages, scheduled maintenance alerts are sent out to clients 7 days before the maintenance is scheduled to occur. For emergency maintenance, status messages are sent out 1-2 hours before the maintenance is scheduled to occur.
Access is limitedTo get access to the operations status page, contact your Pismo representative.
Subscribe to notifications
To receive messages about status changes in the Production environment, maintenance activity, or incidents, click Subscribe to updates.
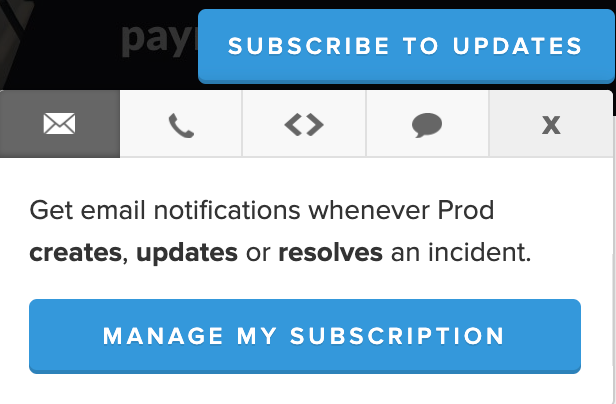
Click Manage My Subscription to select which system components you want to receive updates about (the default is All). You can register to receive status update via:
- Text message
- Webhook
You can also Open a service request directly from this dialog.
View status messages
At the top of the Pismo status page is a high-level status message. Typically, this message reads All systems operational), but you also may see a message about a current ongoing operation, similar to the following.
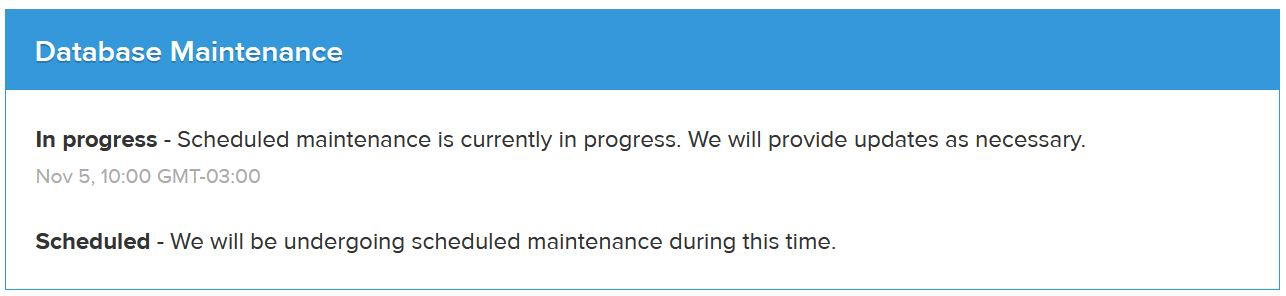
Scheduled maintenance activityPismo posts notification messages in advance of all scheduled maintenance on the on the operations status page. In case of an incident related to a pre-communicated maintenance activity, Pismo reserves the right to decline the request but will provide an explanation for the decision.
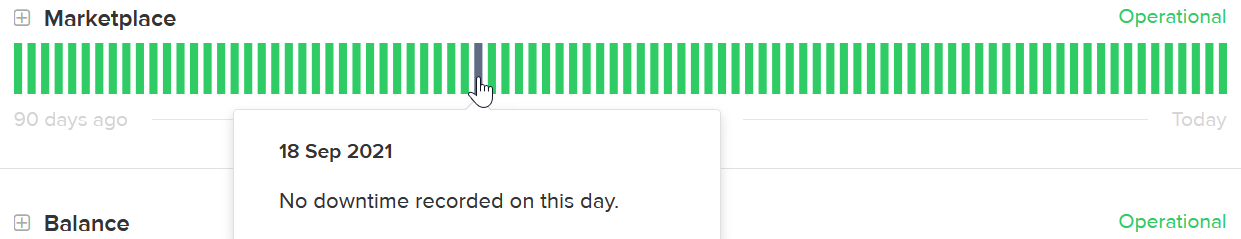
Below the status messages are 90-day daily performance graphs for each system, such as Gateways, Account Management, and PCI Networks. To see details about a specific system, click the plus (+) sign next to its name. To see operational status for a specific day, hover over a bar.
Below the daily performance graphs, the status page has the following sections:
- Scheduled Maintenance: Logged scheduled maintenance. Click an entry's link for more information. May not appear if no maintenance is scheduled.
- Past Incidents: Past logged incidents. Click on an entry's link for more information.
View uptime and historical data
Pismo also provides historical data about system operations. To see this information, click View historical uptime.
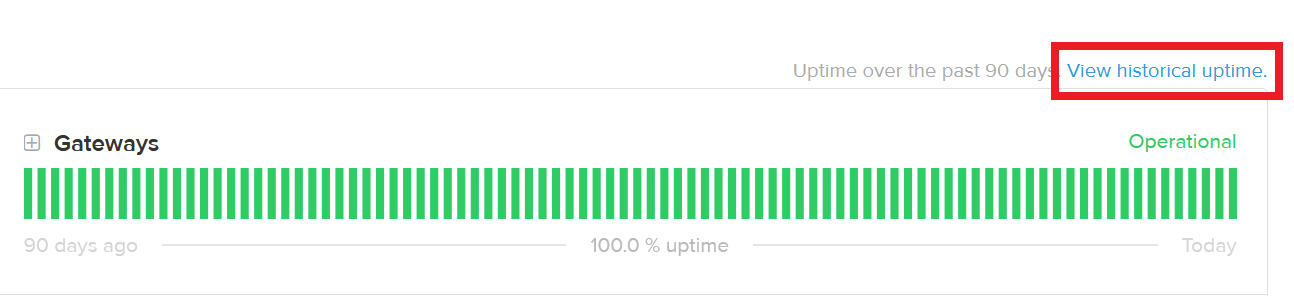
Current data, in calendar graph form, appears for the first system.
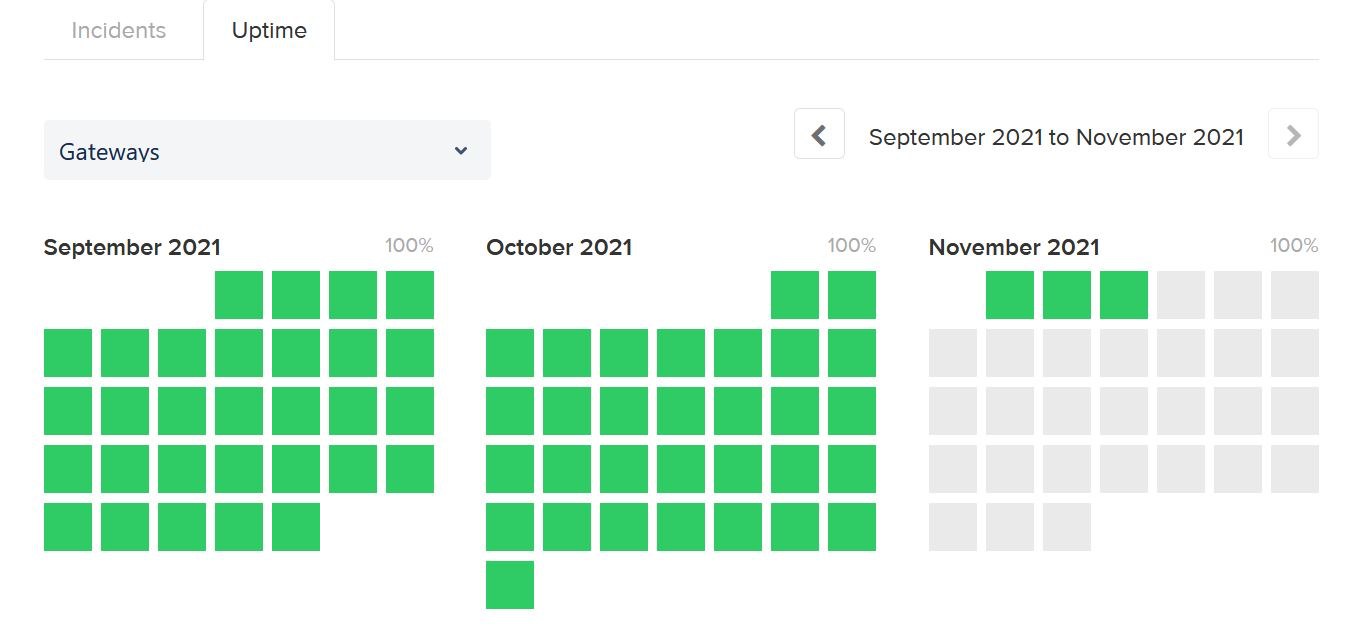
On this screen, you can:
- Use the drop-down menu to switch between systems.
- Use the arrow buttons to switch among 90-day time spans.
- Hover over a green square for data about a specific day.
View reported incidents
To see logged incident reports, click the Incidents tab.
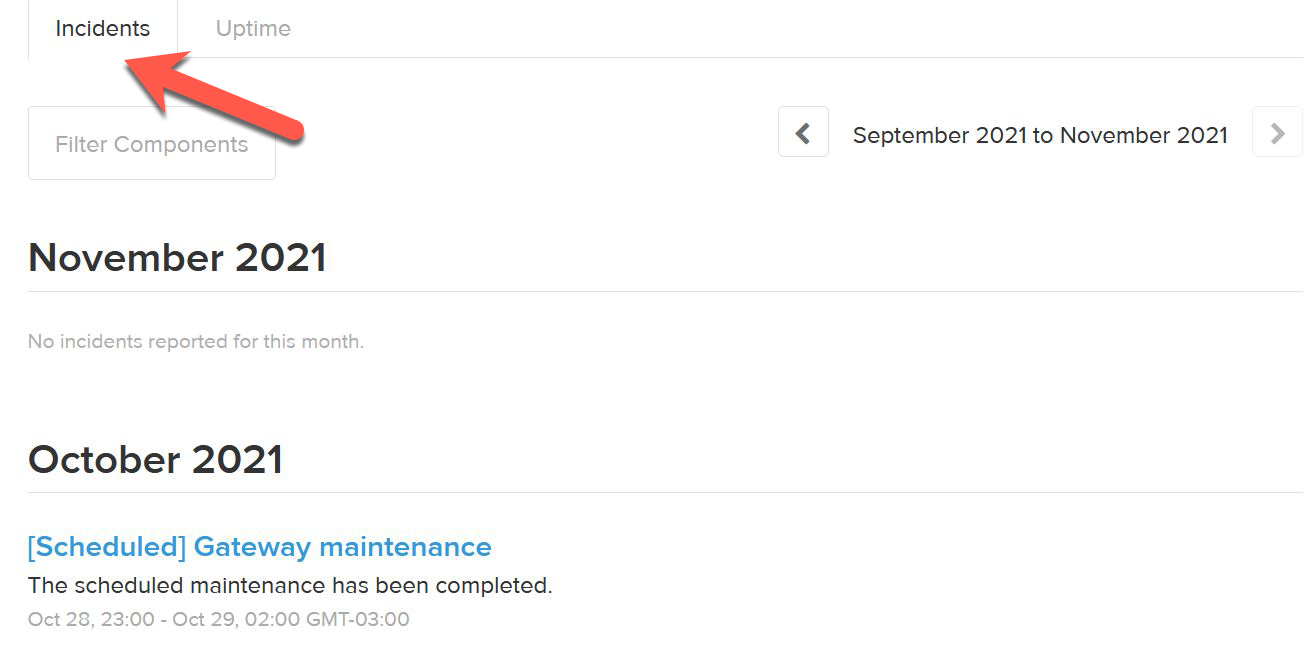
On this screen you can:
- Click an incident link to access more information.
- Use the Filter Components menu for a list of logged incidents for a specific system component.
- Use the arrow buttons to switch among 90-day time spans.
Updated about 1 month ago