Help and support
If you need help using Pismo Control Center that isn't covered in this documentation, first contact your Control Center administrator. For information about getting a Control Center user account, refer to Get access.
Supported browsers
Control Center supports the most recent long-term support (LTS) releases of Chromium-based web browsers, including Google Chrome, Microsoft Edge, and Opera.
Getting help
To get help with a Control Center issue that your administrator can't resolve, open a request with the Pismo Service Desk.
Session ID and other details
When requesting help from the Pismo Service Desk, it's always a good idea to provide details about your current login session. Every time you sign on to Control Center, the platform assigns you a unique session ID. This ensures that your activities in Control Center do not overlap with those of another user. The ID is also helpful for troubleshooting your service request.
To find your session ID, as well as other details, select the Profile icon at the top right of any Control Center screen. For more information, refer to Navigation. The following table describes the items is the profile menu.
| Item | Description | |
|---|---|---|
| User name | Email address used as Control Center user ID. | |
| Report log | Details about your current Control Center login session can include in your service request. Refer to Report log (below). | |
| Exit | Exit Control Center without closing the current browser tab. | |
| Session ID | Unique ID for your current Control Center login. | |
| Version number | Version of the Control Center application being used. |
Report log
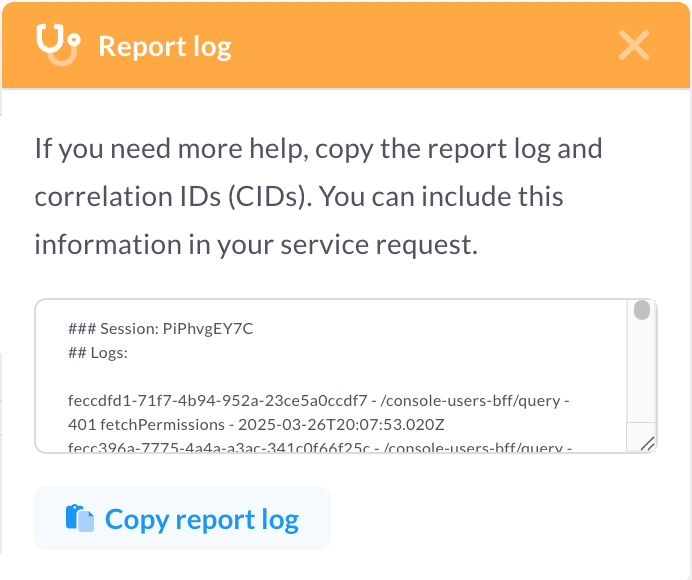
When a Control Center request fails, the application automatically displays a popup message below the Profile icon. The message includes a session log with details about your current login session. The Copy report log button in the popup copies the report text to your computer's clipboard. You can paste this info from the clipboard into the description when you create your service request. You can also open the popup manually by selecting Profile > Report log.

Every error event in the report log consists of the following elements: x-cid - pathname - statusCode - operationNameGraphql - date.
| Element | Description | Example |
|---|---|---|
| x-cid | Correlation ID used to group a series of related API requests and events. For example, in response to an authorization request with 10 installments, the Pismo platform generates one authorization event and 10 transaction events, all with the same x-cid. | fecc8fa6-3564-4dcc-bd28-a9f237ba63bc |
| Endpoint path name | Endpoint called. | /crm-core-bff/query |
| statusCode | HTTP response status code. Errors are identified with when the statusCode is one of the following: 400, 403, 405, 409, 500, 502, 503, 504 (but not 401 or 404). | 500 (Internal Server Error) |
| operationNameGraphql | Operation performed by the endpoint. (GraphQL is a runtime for executing API requests.) | getTotalTransactionsPerformed |
| Date-time stamp | Date and time the operation occurred. | 2025-03-26T21:09:24.742Z |
Log entries
Event log entries are categorized as follows.
- Probable issues: Logs with possible errors, limited to the last 50.
- Other logs: Logs of other requests, limited to the last 50.
- More logs: Notification logs, limited to the last 10.
Updated 18 days ago